All Your Athlete Data. One Platform. Actionable Insights.

Track everything that matters — 1RMs, force-velocity data, GPS and VBT outputs, wellness scores, sprint times, and sport-specific assessments — and connect it directly to your programming. No more parallel spreadsheets or manual Power BI builds.

Background image.
Athlete and trainer - performance training.
Performance trend graph.

A Metrics Hub That Connects Data to Training

FYTT's Metrics Hub brings all your performance data into one place — and connects it directly to your programming and decision-tree automations. Data that used to sit in a separate spreadsheet or dashboard now drives the training plan.

Create custom metrics for any data point: estimated 1RMs, sprint splits, VBT velocity outputs, position-group benchmarks, or any proprietary assessment your program uses

Use simple formulas to derive calculated metrics — like an estimated max from submaximal test data

Configure metric colors so every report and leaderboard is visually consistent with your system

Set team-specific metric scopes to keep each team's workspace focused on what's relevant to them

Background image.

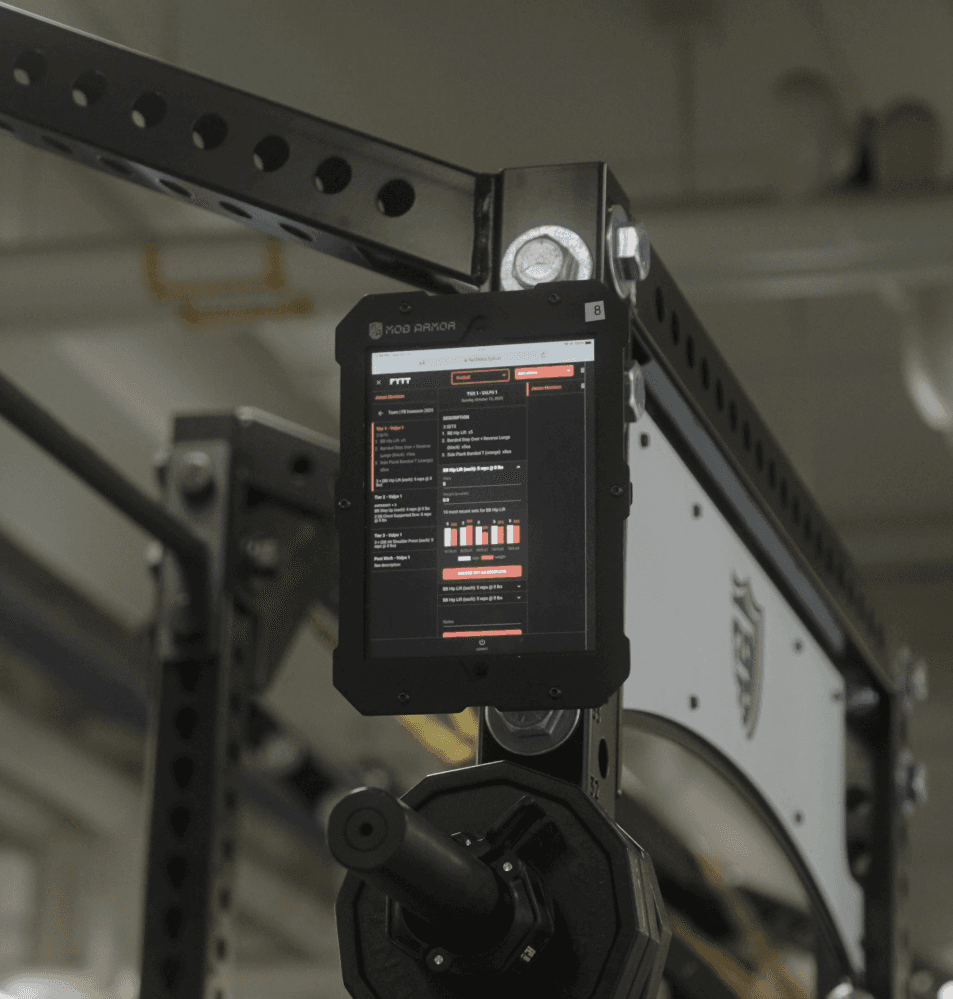
Standardized Testing Protocols

Create testing protocols directly in FYTT with written instructions, video demonstrations, and defined measurement fields. Every coach on your staff runs the same test the same way, so the numbers you collect actually mean something when you compare them across athletes, groups, or seasons.

Build protocols with step-by-step text and video instructions for any testing battery

Reduce measurement error across sessions and staff members

Calculate sprint profiling data from split times and basic environmental conditions

Attach testing protocols directly to your training calendar so data collection becomes part of the normal training flow

Background image.

Don't just collect data. Make it drive decisions.

Most performance programs are sitting on valuable data they never act on. Manual analysis takes too long, so decisions get made on instinct instead of evidence. FYTT closes the gap between data collection and training execution.

Heart rate, distance, and GPS load from field sessions

Strength loads, rep counts, and VBT outputs from the weight room

Readiness, recovery, and wellness scores from surveys

All of it feeding the same decision-tree logic that adjusts your programs automatically

Heart Rate

Distance

Strength Load

Background image.

Surveys for Wellness & Readiness Monitoring

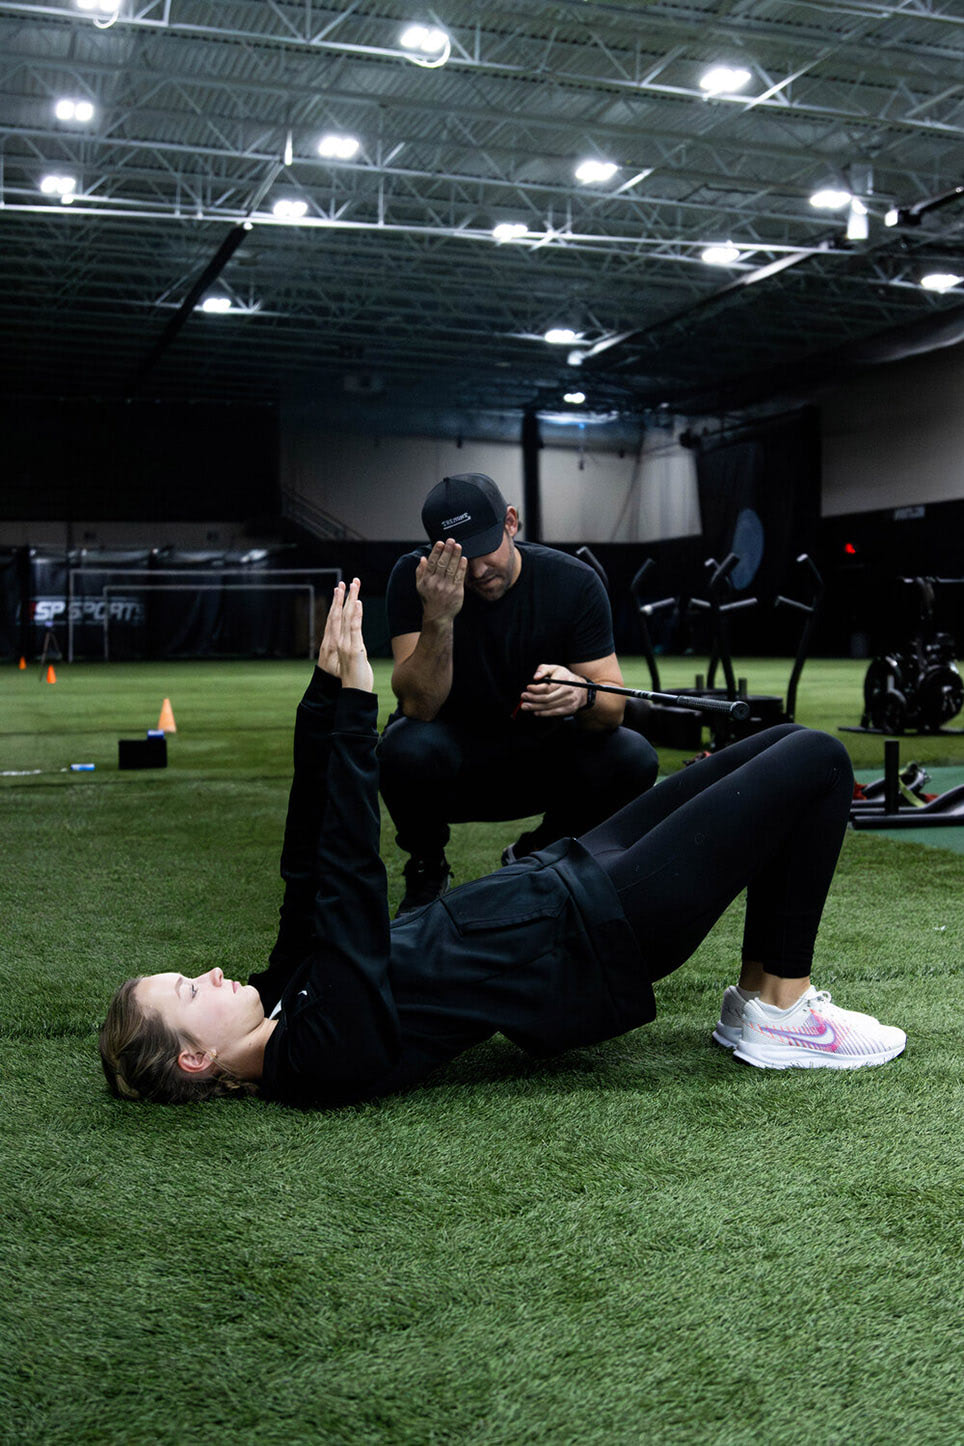
Capture Athlete Feedback Consistently

Get consistent, high-quality athlete input by making data collection part of the everyday training flow — not a separate task athletes have to remember to complete.

Deploy custom wellness and readiness surveys with scheduling so athletes receive them automatically

Embed surveys directly into the training program — athletes answer at the start of their workout, not as a separate step

Survey responses flow into athlete profiles, feed decision-tree automations, and appear in reports alongside objective performance data

Map numeric survey responses to plain-language text values for reporting that non-technical stakeholders can read immediately

Mobile app - training log
Background image.

HIPAA-Compliant & Secure by Design

Protect Sensitive Health Information

FYTT is built to the data security standards required by collegiate athletic departments, professional organizations, and healthcare-affiliated performance programs.

HIPAA and FERPA compliant — all data encrypted in transit and at rest

Role-based access controls so each staff member can see only what they need

PHI isolation keeps injury records, health interventions, and sensitive medical data visible only to authorized staff

Supports cross-disciplinary collaboration without compromising privacy standards

Background image.

Track Anything. Measure What Matters.

Create Metrics for Whatever You Need to Measure

FYTT allows teams to create completely custom metrics and formulas based on their sport, population, and methodology.

Strength and power: 1RMs, estimated maxes, force plate data, VBT outputs

Speed and conditioning: sprint splits, GPS distances, conditioning test benchmarks

Wellness and readiness: sleep quality, soreness, stress, mood, HRV

Body composition and anthropometrics

Sport-specific assessments: position group benchmarks, proprietary combine protocols

Background image.

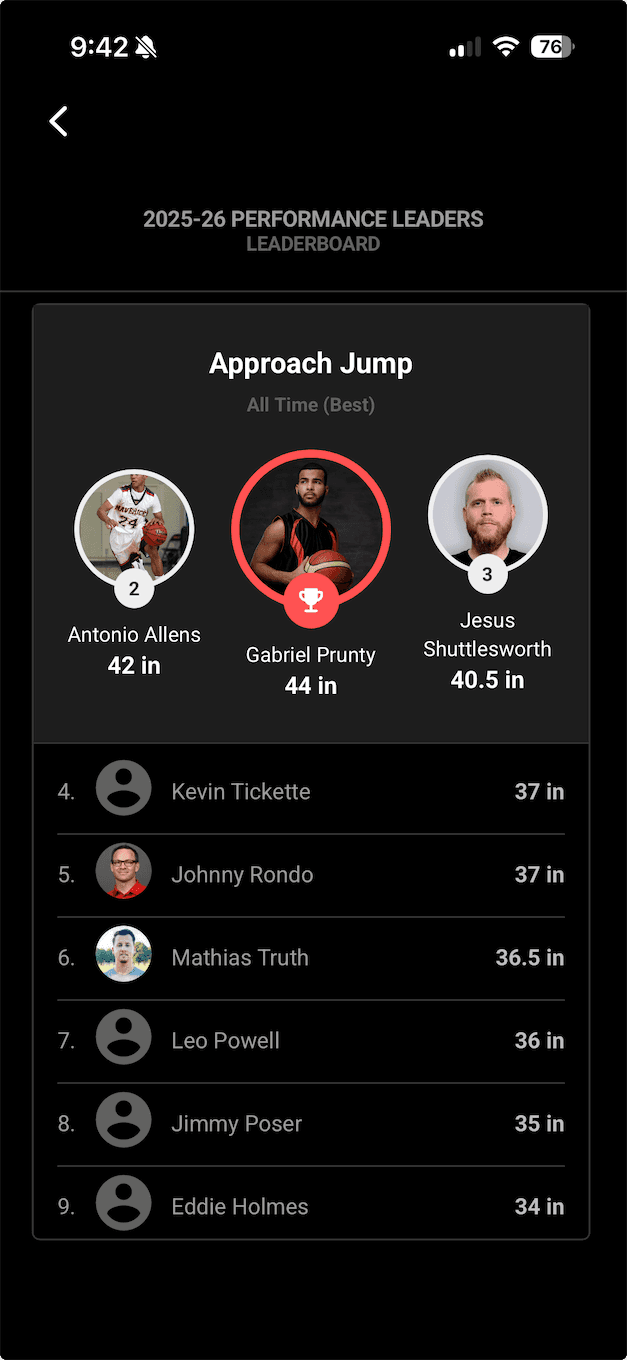
Reports, Leaderboards and Data Export

Turn data into clear insight — and share it with anyone who needs it

Your data is only useful if you can communicate it clearly to coaches, athletes, administrators, and medical staff. FYTT gives you the reporting and visualization tools to turn raw numbers into decisions and conversations.

Build group reports with aggregate rows showing cohort averages, best performances, and trend data across your whole roster

Display leaderboards in the weight room or share them directly with athletes showing percentile rankings within their position group or team

Use pre-built attendance and training compliance reports to spot gaps before they affect performance

Export training logs with full prescribed-vs-actual data for every set and every parameter

FYTT Mobile App
Background image.

TESTIMONIALS

Trusted by High-Performance Athletics

Jess Rigaud

Ski Club Vail

“I can monitor progress, adjust training loads instantly, and ensure athletes gets the right stimulus at the right time.”

Background image.

TESTIMONIALS

Trusted by High-Performance Athletics

Jess Rigaud

Ski Club Vail

“I can monitor progress, adjust training loads instantly, and ensure athletes gets the right stimulus at the right time.”

Background image.
Weightlifter training.
Background image.

Turn Testing Data Into Training Decisions

See how FYTT’s metrics hub can consolidate your data and drive your programming.

No credit card required. Cancel anytime.

Background image.
Weightlifter training.
Background image.

Turn Testing Data Into Training Decisions

See how FYTT’s metrics hub can consolidate your data and drive your programming.

No credit card required. Cancel anytime.